
Overview
Breast cancer is the most common cause of deaths from cancer among women in the United States.
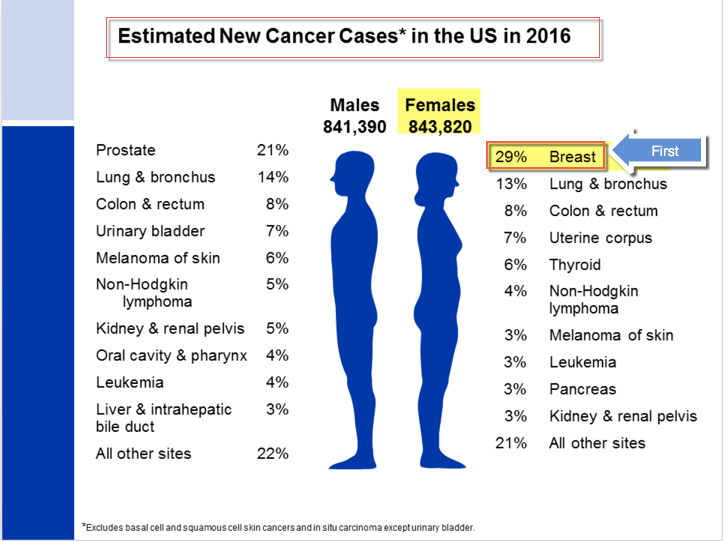
According to the American Cancer Society statistics 2016, it is estimated that almost 1.7 million new cases of cancer will be diagnosed in 2016. Prostate cancer is the most common cancer among males (21%), followed by lung (14%) and colorectal (8%) cancers. Among females, breast (29%), lung (13%), and colorectal (8%) cancers are the most common
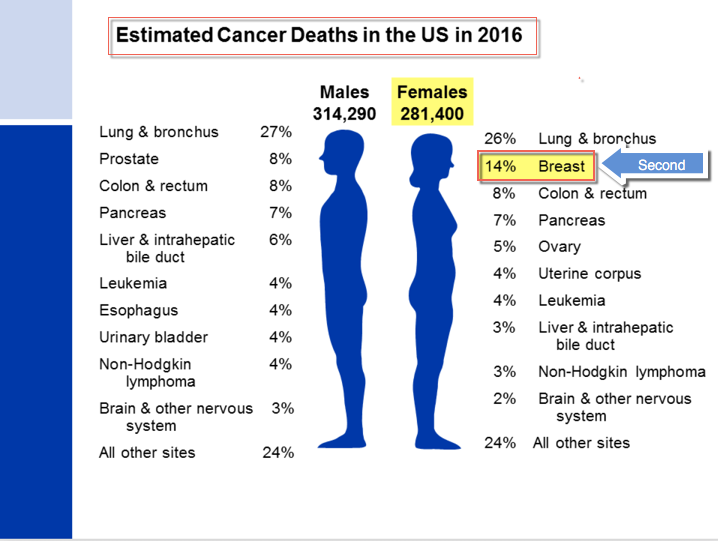
In terms of cancer mortality. Lung cancer is by far the leading cause of cancer death among males (27%), followed by prostate (8%) and colorectal (8%) cancers. Among females, lung (26%), breast (14%), and colorectal (8%) cancers are the leading causes of cancer death.
Problem Statement
The aim of this capstone project is to determine which factors have more incidence in the breast cancer diagnosis after a regular mammogram. At the same time, I will build a model to predict the probability of breast cancer based on those factors. I will be also creating an interface to predict the probability of breast cancer after entering the factors using the model.
Dataset Background
The dataset used in the present project includes 2,392,998 screening mammograms (called the "index mammogram") from women included in the Breast Cancer Surveillance Consortium (BCSC) and results were published by Barlow et al. in the September 2006 issue of the Journal of the National Cancer Institute. The women in this dataset did not have a previous diagnosis of breast cancer and did not have any breast imaging in the nine months preceding the index screening mammogram. However, all women had undergone previous breast mammography in the prior five years (though not in the last nine months). Cancer registry and pathology data were linked to the mammography data and incident breast cancer (invasive or ductal carcinoma in situ) within one year following the index screening mammogram was assessed. There is one observation per woman, as opposed to multiple observations. All population and all other characteristics remain the same.
This dataser has 9 years of data from 2000 to 2009.
Data Dictionary
| Variable Name | Description | Coding |
|---|---|---|
| year | Calendar year of observation | Numerical, 2000-2009 |
| age_group_5_years | Age (years) in 5 year groups |
|
| race_eth | Race/ethnicity |
|
| first_degree_hx | History of breast cancer in a first degree relative |
|
| age_menarche | Age (years) at menarche |
|
| age_first_birth | Age (years) at first birth |
|
| BIRADS_breast_density | BI-RADS breast density |
|
| current_hrt | Use of hormone replacement therapy |
|
| menopaus | Menopausal status |
|
| bmi_group | Body mass index |
|
| biophx | Previous breast biopsy or aspiration |
|
| breast_cancer_history | Prior breast cancer diagnosis |
|
| count | Frequency count of this combination of covariates | Numerical |
Data Mining
I created Postgres Local Data Base to move the data set to a table and to be able to run sql queries on two million records for EDA purposes, and to create mini data frames for plotting and research.
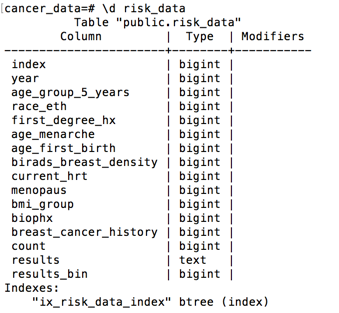
Table risk_data - see column description in the above data dictionary
EDA / Findings
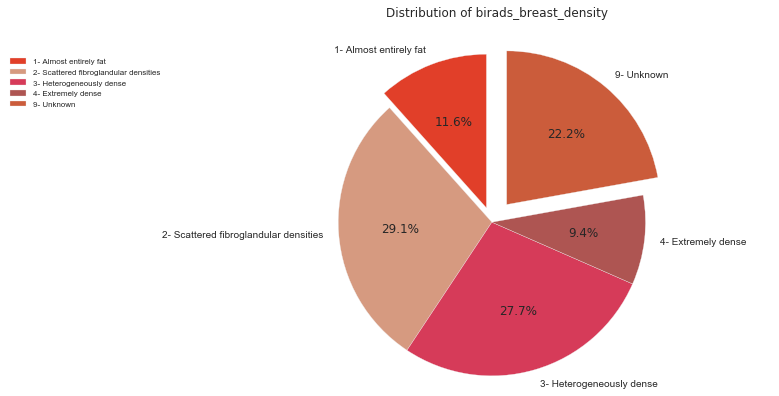
We can see in the above Pie Chart
- That 22.2 % of our dataset has birads_breast_density UNKNOWN.
- 40.7% is under birads_breast_density 1 and 2 which is considered "Benign"
- And 37% is under birads_breast_density 3 and 4 which will require extra screening
The chart above tells us that the most records are from Women on the age range 50-54. Followed by range 45-49.
We can also infer that from 40-64 women tend to do their mamogram more actively.
We can see in the above Horizontal Bar Chart above that more than the half of the dataset is composed of Non-Hispanic White women patiens. 44.08% other races being lead by "Hispanic" with 13.93%
Age_menarche is how old the patient was when she got her first period. It seens to be one of the factor with more incidence
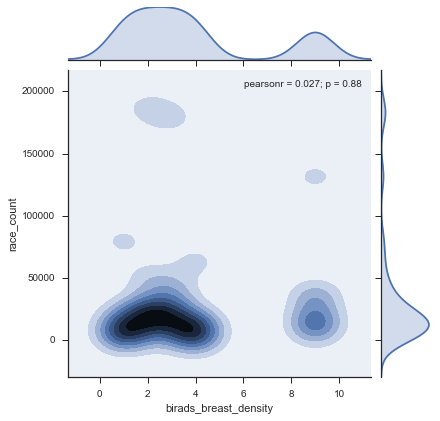
This jointplot shows that most of population in concentrated on the BiRads between 2 and 3
This last bubble chart is a visual representation of the relationship between race and the Brads classification
Risks and Assumptions
The risk of modeling is always to be able to obtain accurate relative results from predicting based on factors, such as demographics, reproductive history, medications, genetic factors (e.g., family history and susceptibility genes), and clinical and biologic markers (e.g., bmi - Body mass index). How these factors act jointly on risk also is important. These relative risk and attributable risk estimates, as well as missing or biased data has to be taken into account when reviewing the results of the present study
The Statistical techniques used to calculate risk include empirical analysis thru EDA and logistic regression as well as other classifiers that were compared based on their metric scores
Model
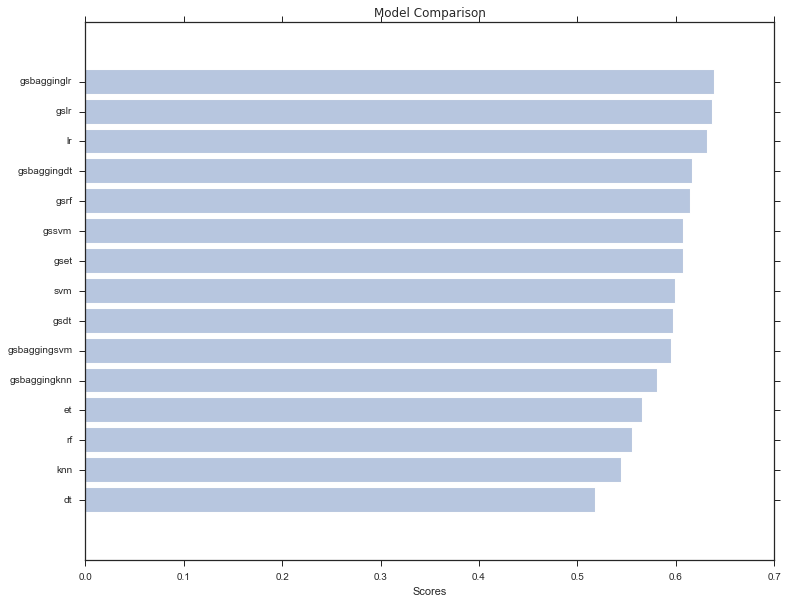
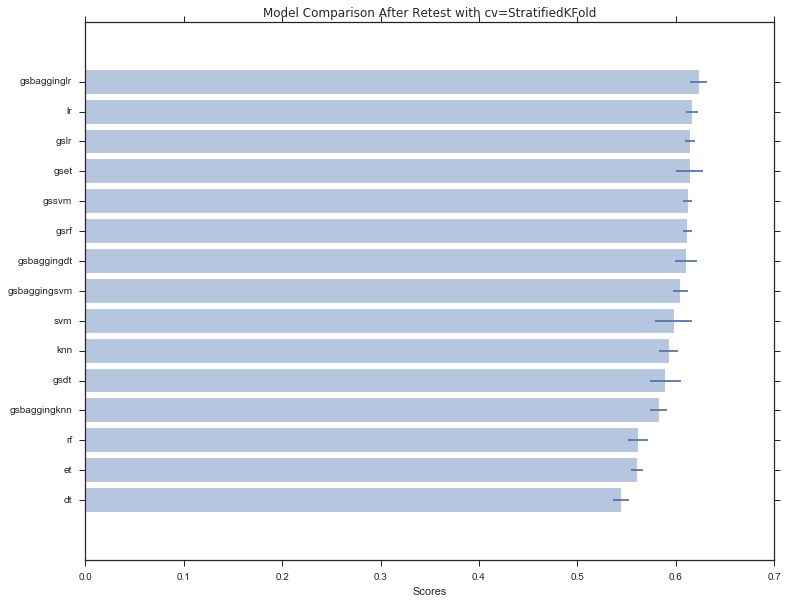
I compared the classifiers below. It may seem like a lot, but the purpose was to select the best classifier based on mse and std.
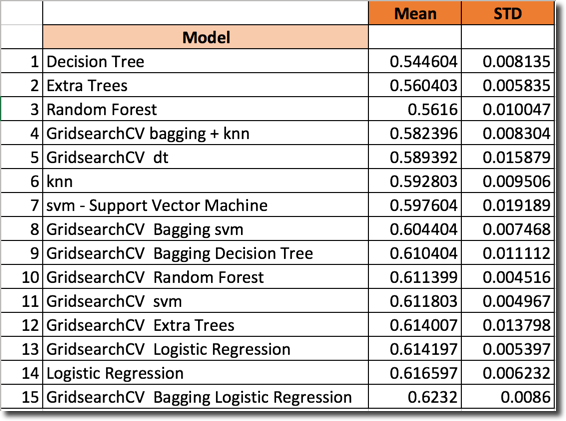
I trained and tested on a hold-out sample (20% of the dataset).
Each model used the following features from the data:
Features:
- age_menarche - Age (years) at menarche
- age_group_5_years - Age (years) in 5 year groups
- race_eth - Race/ethnicity
- first_degree_hx - History of breast cancer in a first degree relative
- breast_cancer_history - Prior breast cancer diagnosis
- age_first_birth - Age (years) at first birth
- current_hrt - Use of hormone replacement therapy
- menopaus - Menopausal status
- bmi_group - Body mass index
Target:
Results based on BI-RADS breast density:
- 0 - Negative - Low risk
- 1 - Positive - High Risk
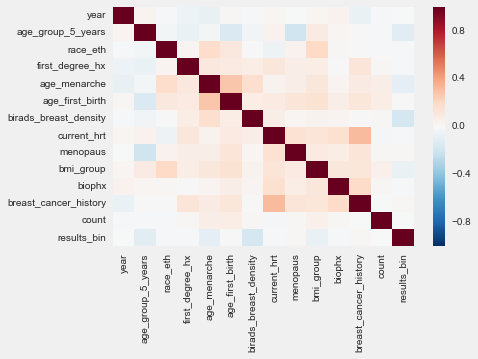
Evaluation data correlation
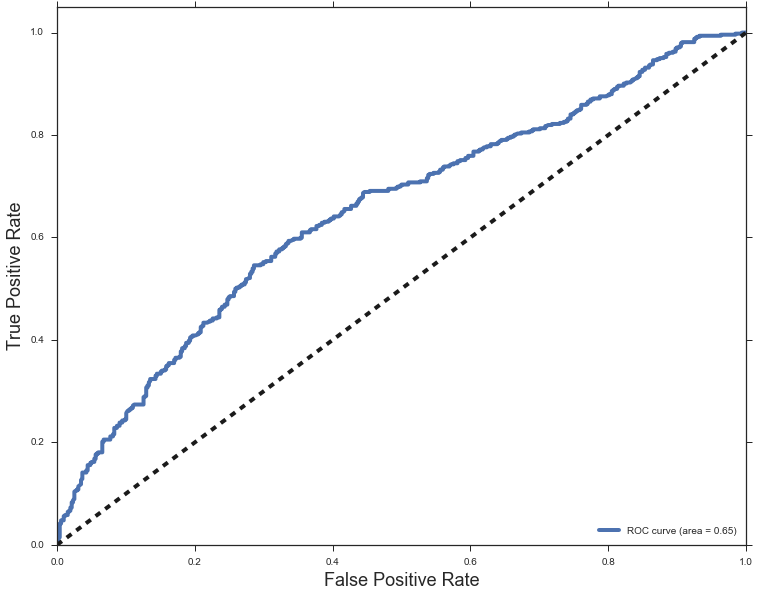
Model ROC curve and score
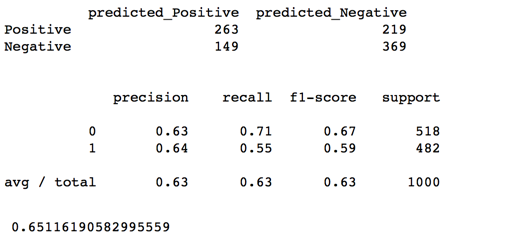
Confusion and precision tables
Model Comparison
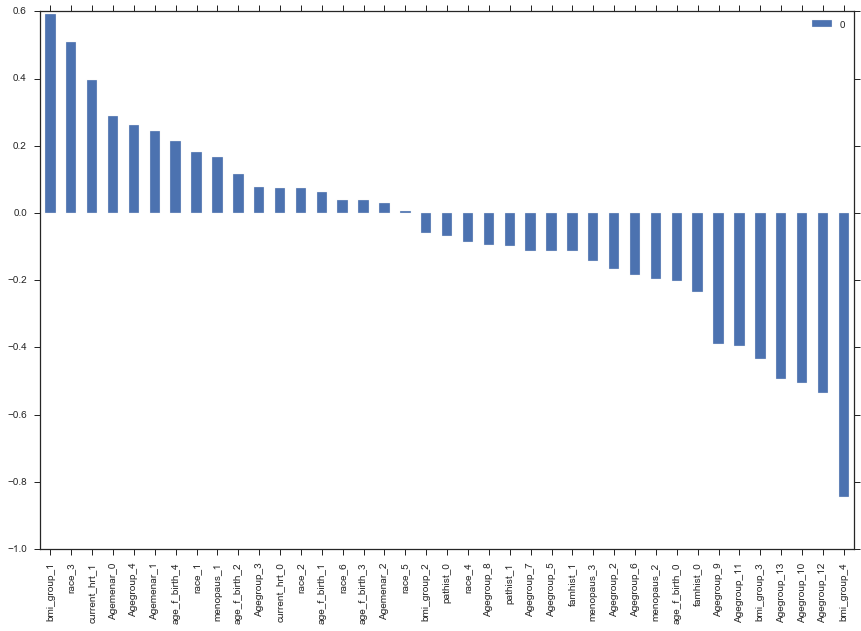
Evaluating Coefficients
Results and Conclusion
I have developed a prognostication model for early breast cancer based The Breast Cancer Surveillance Consortium (BCSC) index mammogram dataset. The model predicts breast cancer probability after a mammogram is done. The probability is based on BI-RADS breast density which is part of the dataset. The performance and score have been compare among several classifiers. The best performer was GridsearchCV Bagging Logistic Regression. I picked the Logistic regression because of its simplicity
Being able to predict breast cancer outcomes more accurately would help physicians make informed decisions regarding the potential necessity of research and treatment in women patients
Next Steps
The model needs to be better calibrated with more data, and also validated with and evaluated by professionals in the area
It would be beneficial to research the BCSC dataset bank and more features to improve score


