Group Members: Peida Cai, Betsy Zimmermann, and Maria Pichardo
Overview
This week we worked with web scraping and logistic regression. In this project, we will practice two major skills. Collecting data by scraping a website and then building a binary predictor with Logistic Regression.
We are going to collect salary information on data science jobs in a variety of markets. Then using the location, title, and summary of the job, we will attempt to predict a corresponding salary for that job.
Problem Statement
A contracting firm that is rapidly expanding needs to leverage data to win more contracts and wants to be competitive in the hiring market. We need to take a look at what industry factors influence the pay scale for these professionals.
Aggregators like Indeed.com, CareerBuilder.com regularly pool job postings from a variety of markets and industries. Our job is to understand what factors most directly impact data science salaries and effectively, accurately find appropriate data science related jobs in the different cities in US.
Project Goals
The main goals for this project are:
- Collect data on data science salary trends from a job listings aggregator for the analysis.
- Find out what factors most directly impact salaries (title, location, department, etc.). In this case, we do not want to predict mean salary as would be done in a regression. We believe that salary is better represented in categories than continuously.
- Create a classifying model that could predict, for data science job listings that omit salary information, whether the salary would be above or below the median listed salary ($115k) as per the dataset collected from CareerBuilder
Dataset Description
This dataset gathers the data we were able to scrapped from careerbuilder.com with salary information.- JobTitle: The title of the position
- Company: The company requesting the candidate, sometimes it can be a consulting company in between the canidates and the real company
- Location: City and State when the position is required
- Summary: A brief description of the document
- Salary: Usually a salary range. Most of them per year, but you can find per hour, per week, per month
- SalaryType: New created column 'Y' Yearly, 'W' weekely, 'H' Hourly, 'M' monthly
- City: The City extracted from loacation
- State: The State extracted from loacation
- Salary Lower: Salary Lower Range extracted from Salary
- Salary Higher: Salary Higher Range extracted from Salary
- Salary Average: Salary average between Lower and Higher
Data Mining
The following new columns were created to facilitate analysis and reporting:- City
- State
- Salary Lower
- Salary Higher
- Salary Average
- High Salary
Methods
We used webscraping techniques to collect the results from indeed.com and careerbuilder.com. We searched for “data scientist” with salary over $20k, in the most popular cities for data scientists. This results conform the dataset(s) used to train and test the classification models.I personally worked scrapping the careerbuilder site and will present in my blog the careerbuilder.com data behavior but as a group we focused in the indeed.com results. The data was noat merged due to indeed.com having the company rating that was collected and taken as a predictor. In my paticular case with career builder the "company rating" was not part of my model.
Since predicting the actual salary is proven to be difficult due to not having accurate information about the job, the salary field was recoded as a binary: above $115k (“high salary”) or below (“low salary”).
A logistic regression model was used, selecting title, state, summary and city as predictors and the high-salary binary column was the target.
Findings
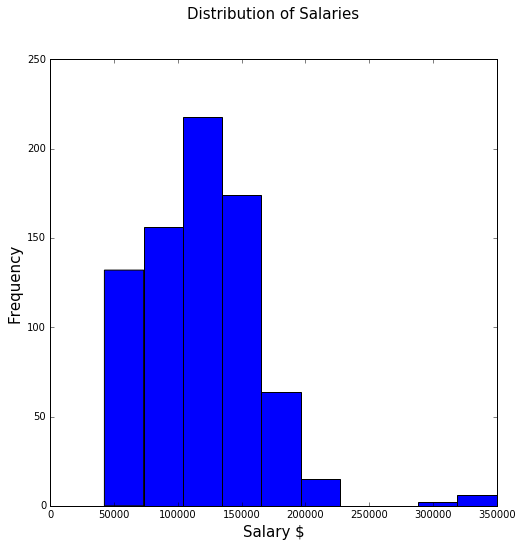
The chart below shows how the distribution between high and low salary jobs varied across the states.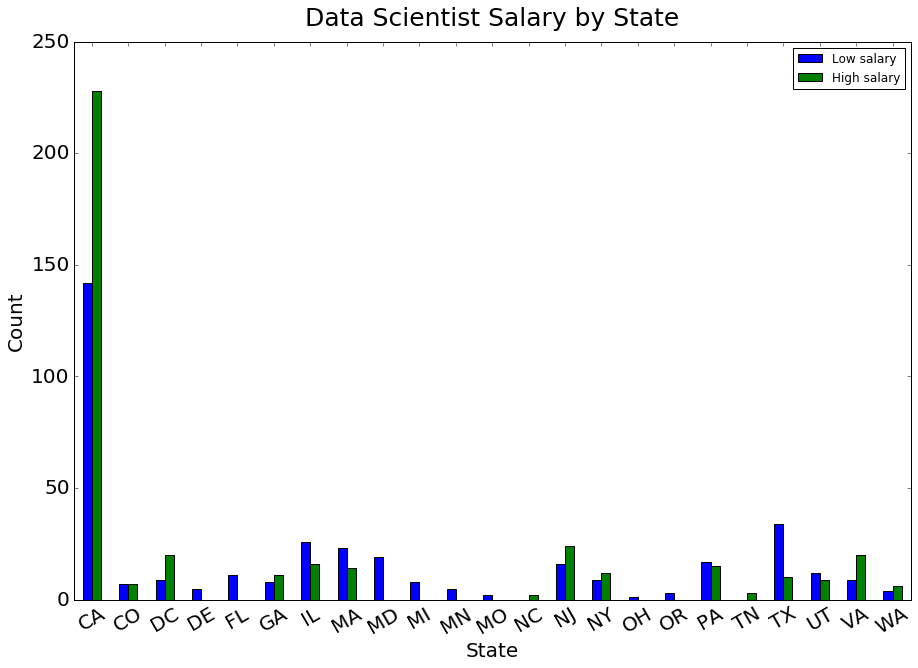 Distribution of the average salary
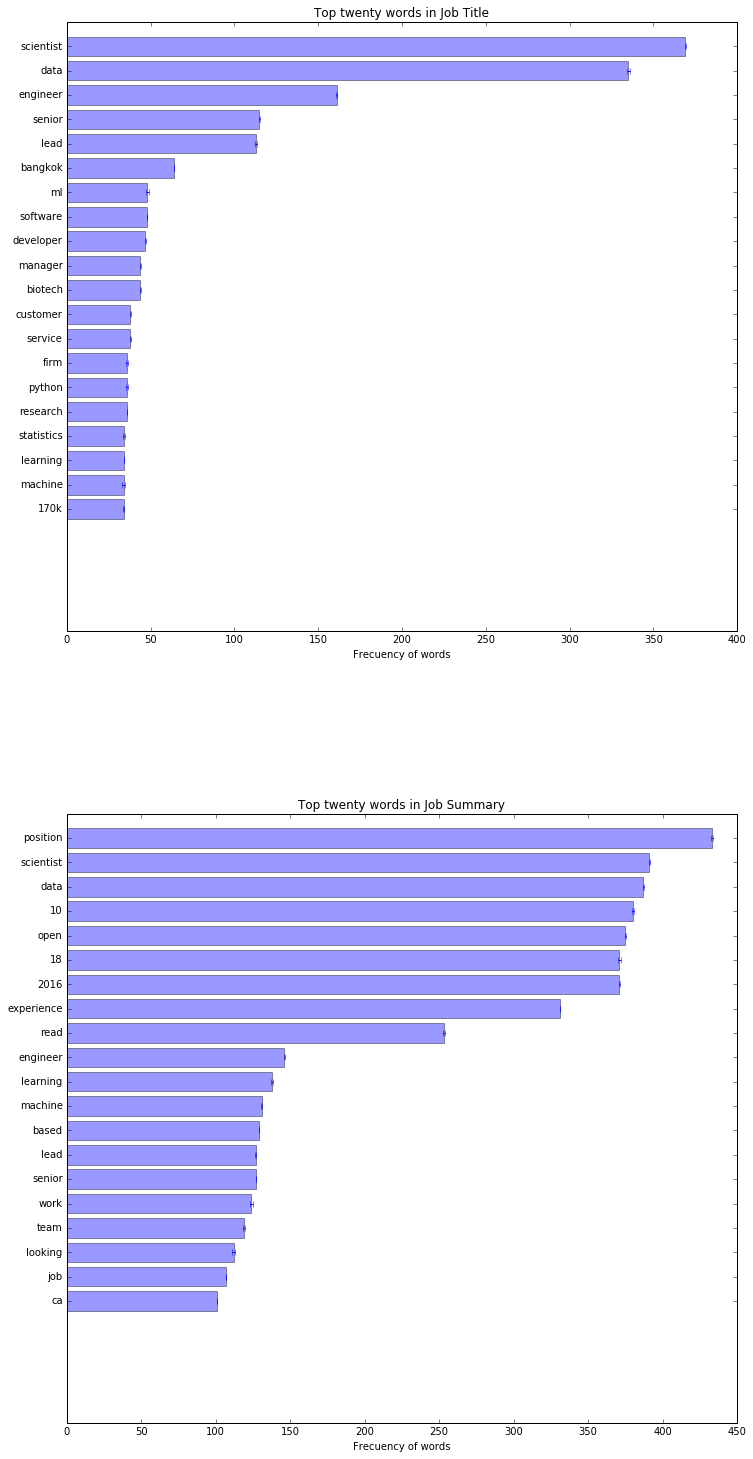
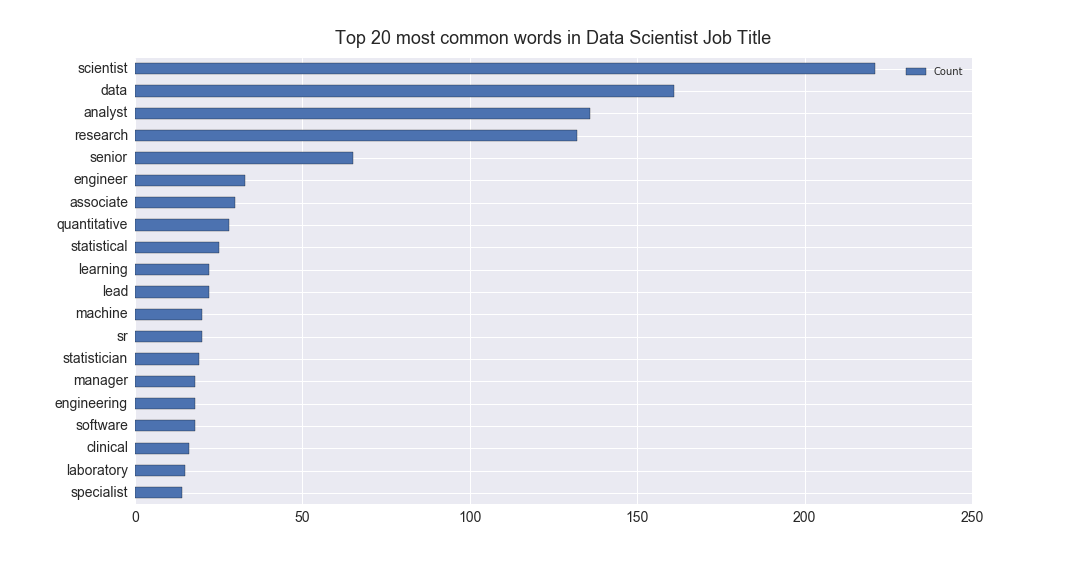
The top 20 most common words that shows up in the Title and summary of a job posting for a Data Scientist in the careerbuilder.com dataset.
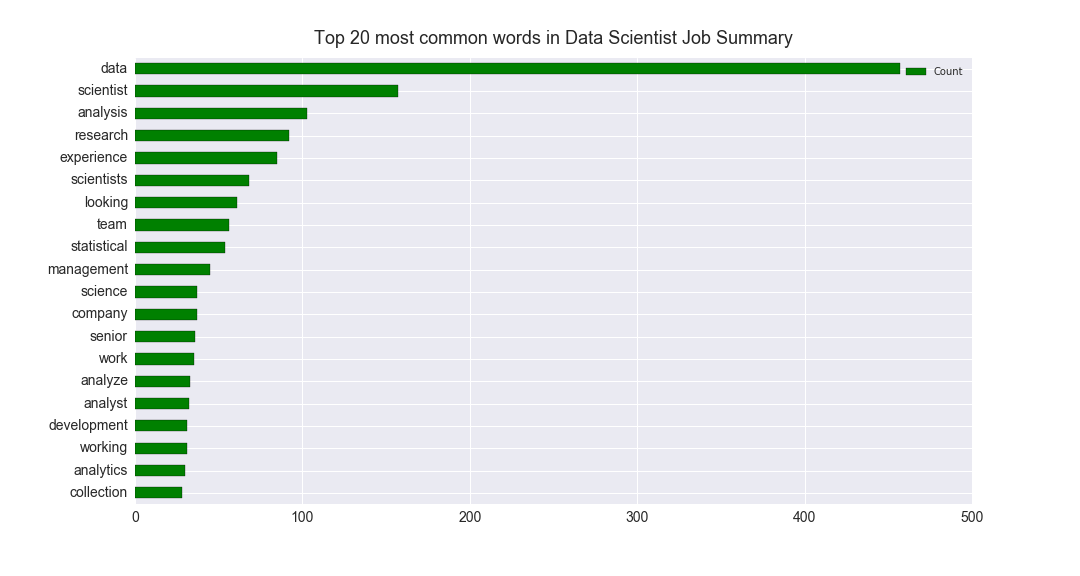
 The top 20 most common words that shows up in the summary and Title of a job posting for a Data Scientist in the Indeed.com
Risks and Assumptions
Only the 10% of the jobs posted in Indeed.com and careerbuilder.com have Salary Information. There are dupplication of job posting among job portals The salary found is given as a range and a lot of hourly, monthl and weekely salaries are posted. We converted them to yearly salaries to be able to do a real comparison. We assumed that the jobs posted were still active and that they represent the behavior of the Job market for Data Scientists.Model
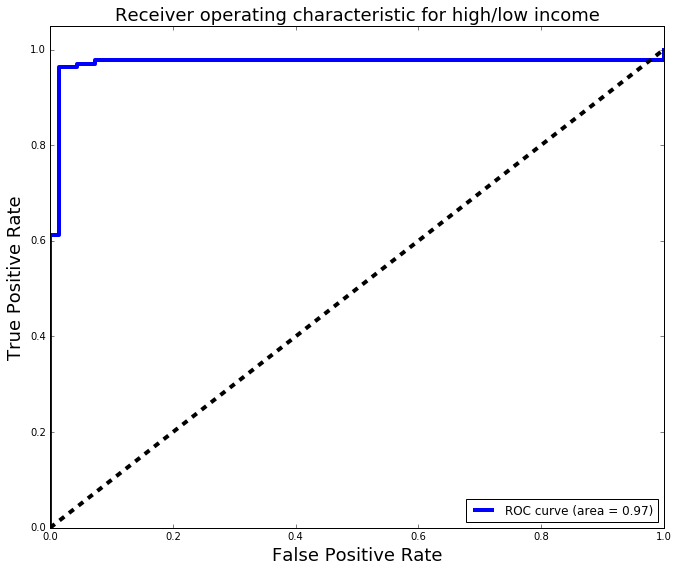
The predictors are: Title, state, summary and city
Our Target: Predict high and low salaries
ROC: 0.97157594381
Results and Conclusions
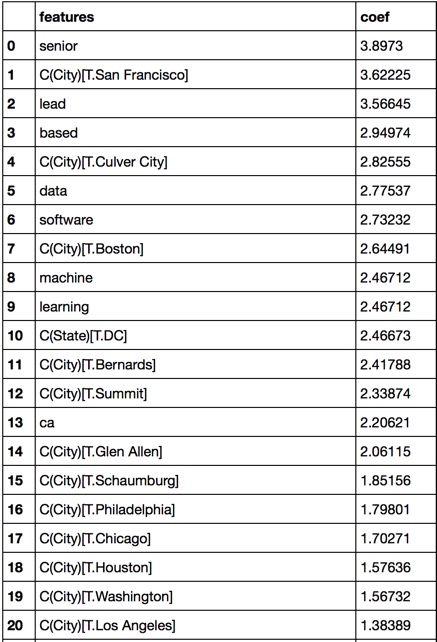
You can see in the coeficients below that having 'senior' in the title and the City of San Francisco as the position location has tremendous impact in determining if the postion will be considered a High Salary one.
 T
TThe model was able to predict with 96% recall, 93% precision a low salary, and with with 96% recall, 98% precision a high salary.
Confusion Table

Classification Report
